- Energy Diagram of Solids
-
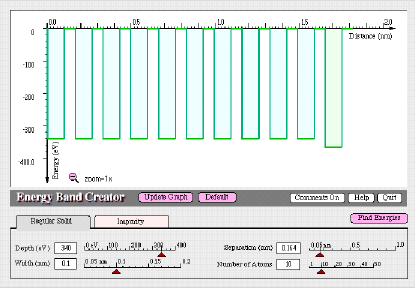
- With the Regular Solid tab visible, create 10 potential energy
diagrams that have a depth of -300 eV, a width of 0.1 nm, and
a separation distance of 0.15 nm. Then, click on the Impurity
tab and change the Impurity Concentration from 0 to 1. Notice
that one of the regular solid potential energy diagrams has turned
green. However, it still represents an atom that is identical
to the others because its potential energy diagram is identical.
To create an impurity, change the depth to -340 eV. Keep the
width at 0.100 nm. The figure below illustrates the resulting
potential energy diagram representation of the solid with a single
impurity atom.


