Creating Wave Functions
After students learn that wave functions are related to the probability of finding an object at various locations, they learn how to sketch a wave function. This sketching is based on a qualitative set of steps that start with potential energy diagrams. Each of the steps is introduced separately and is justified in terms of the probability interpretation of the wave functions or de Broglie's equation.
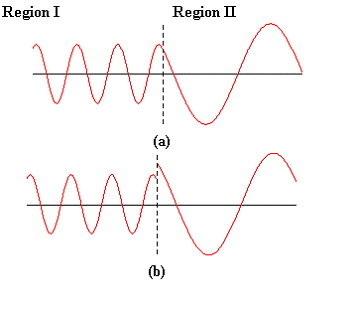
For example, the students learn to divide space into regions based on changes in potential energy. The wavelength for each region is determined for the energies. Then, the students consider graphs such as Figure 2-2 to learn that the wave function must be continuous at the boundaries between regions.
Figure 2-2: The differences in probabilities when approaching a boundary from the left or right in graph (b) leads to the continuity of the wave function across the boundary.
At the end of two activities involving a variety
of situations the students have a complete set of steps for creating
wave functions.
![]()
![]()