LEARNING THE PHYSICS OF A SCANNING TUNNELING MICROSCOPE USING A COMPUTER PROGRAM
N. Sanjay Rebello, Konstantin Sushenk, and Dean A. Zollman
Physics Department, Kansas State University,
116 Cardwell Hall, Manhattan, KS 66506-2601
ABSTRACT
The Scanning Tunneling Microscope (STM) Simulator1 is an interactive computer program designed specifically for pedagogical purposes, to enable students to learn how an STM works. The program is not designed to substitute a real STM, but rather to give students an insight into the physics of the STM.
The program allows the student to start with a real STM image of a sample, taken elsewhere, observe the cross sectional profile of the sample surface along any direction, and relate it to the measured tunneling current from the STM’s probe tip. While the program does not give any quantitatively useful results pertaining to the specific sample that is being observed, it demonstrates how the concepts of potential energy diagrams, wave functions, and tunneling probability can be applied to understand the STM.
No knowledge of higher level mathematics is required to use the program, which is available on the Windows and Macintosh platforms. The flexibility of the program allows it to be used by students over a range of academic levels.
I. INTRODUCTION
We have developed an instructional unit that utilizes the scanning tunneling microscope (STM) as the pedagogical vehicle to explain quantum tunneling to introductory students without the use of higher level math. An STM is prohibitively expensive for most high schools and most standard texts at the introductory level barely mention an STM in passing. Advanced books2-3, have more quantitative explanations and relatively few visualization tools. Hence these books are unsuitable for the audiences we are trying to reach
We thus decided to develop a computer program that is not intended as a substitute for a real STM, but rather enables students to learn the underlying physics.
II. PROGRAM DESCRIPTION
The STM Simulator uses a stored STM image to demonstrate various factors affecting tunneling.
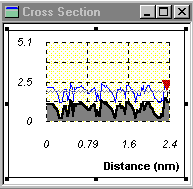
The image file appears in the STM Image window and the student draws a line across it to represent the path of a probe tip, represented by an inverted red triangle (See Figure 1). The program assumes that the colors of the image indicate the elevations of various points on the surface, and reads the colors of the pixels along the line drawn by the student, translating this information into a cross sectional profile of the sample in the Cross Section window (See Figure 2). The numerical scale on the vertical and horizontal axis is not representative of the real sample whose image is being observed, but rather serves as an indication of the surface relief.
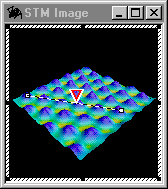
Figure 1: The image of atoms taken using a real STM is displayed by the program. The line drawn across the image indicates the path over which the triangular probe tip has scanned the image.
The Cross Section window displays the profile of the sample’s surface and the movable probe tip as a red triangle just above the surface. In reality the tip radius is much larger than the features on the surface, but this program idealizes the probe tip to be a point. The program assumes that the probe tip is at a positive voltage with respect to the sample’s surface and determines the vertical electric field line from the probe tip to the surface (See Figure 2).

Figure 2: The cross sectional profile of the sample constructed from reading off the intensities along the drawn on the STM image (Figure 1). The position of the probe tip and resulting electric field line are also shown.
Next, the program calculates the potential energy diagram of the electron that tunnels along the field line, for a specified probe tip voltage. An unrealistically large probe tip voltage of up to 10V is used in the program to accentuate the triangular shape of the potential energy diagram, so that students change this voltage and observe changes in the Potential Energy window (See Figure 3). To simplify the shape of the potential energy diagram, the program also assumes that all the applied voltage drops across the gap between the sample and probe tip.
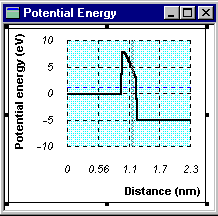
Figure 3: The potential energy diagram for an electron on the field line (Figure 2) for a probe tip voltage of 5V and barrier height of 8eV. The two regions of constant potential energy to the left and right correspond to inside the sample and probe tip respectively.
The "barrier height" parameter is the abrupt change in potential energy when the electron leaves the sample, or the difference in electron affinities between the sample and air. It has a default value of 5V in the program, which can be changed to reflect the change in the sample material. Students move the probe tip in the Cross Section window to observe changes in the potential energy diagram.
Students change the total energy of the tunneling electron on the potential energy diagram and observe its corresponding wave function (See Figure 4) in three regions: sample, air gap, and probe tip. Next, in the Tunneling Probability window they observe the tunneling probability vs. total energy for a constant probe tip voltage as well as the tunneling probability vs. probe tip voltage for a constant total energy (See Figure 5). The values of tunneling probability in both graphs are unrealistically high, primarily due to the unusually high probe tip voltage of 10V, but the general shape of these graphs is qualitatively correct.
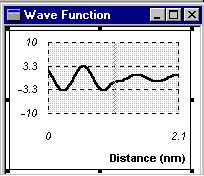
Figure 4: The wave function of an electron of a particular energy indicated on the potential energy diagram (Figure 3).
 |
 |
|
(a)
|
(b)
|
Figure 5: (a) The variation of the tunneling probability with electron energy for a fixed probe tip voltage, and (b) The variation of the tunneling probability with probe tip voltage for a fixed electron energy.
So far students have focused on abstract physical quantities such as the barrier, wave function, and tunneling probability, for a single electron with a particular energy. In reality several electrons over a range of energies tunnel simultaneously, constituting a measurable tunneling current
Students observe the tunneling current vs. voltage (I-V) graph (See Figure 6) which is calculated from the weighted contributions of electrons of all energies. Again, the numerical values of the current are unrealistically high, although its variation with voltage is qualitatively correct. Students explore the changes in the I-V graph with robe tip position and determine the positions at which the tunneling current is most sensitive to the probe tip voltage.

Figure 6: The I-V graph of the tunneling current for a given position of the probe tip as chosen by the student (Figure 2).
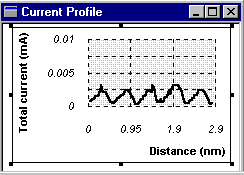
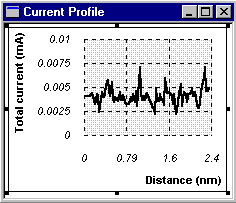
In the Current Profile window students observe the changes in the tunneling current as the probe tip is moved over the surface of the sample. In the "constant height" mode, the student can move the probe tip along a horizontal straight line over the sample’s surface (See Figure 7). The Current Profile window displays the correlation between the increase and decrease in the tunneling current with peaks and troughs in the cross section of the sample. In the "constant current" mode the program vertically moves the probe tip up and down to compensate for the bumps and troughs in the surface cross section, to maintain a virtually constant tunneling current profile (See Figure 8). Real STMs in this mode have a feedback control system that monitors the increase or decrease in current and moves the probe tip up or down to keep the tunneling current constant. The vertical motion of the probe tip follows the profile of the sample’s surface, so that the current in the Current Profile window is kept virtually constant (See Figure 8). In a real STM, however, there are other mechanical interactions between the probe tip and features on the sample, with which affect the final image produced by the STM.
 |
 |
|
(a)
|
(b)
|
Figure 7: (a) The path of the probe tip in the "constant height" mode. (b) The current profile in the "constant height" mode shown in (a), so that the variation in the tunneling current corresponds to the relief in the sample’s surface.
 |
 |
|
(a)
|
(b)
|
Figure 8: (a) The path of the probe tip in the "constant current" mode. (b) The current profile in the "constant current" shown in (a), so that the tunneling current remains relatively constant, except for the spikes.
Hence, by using the program, as described in this section, the student begins with a real STM image and constructs the current profile that would match the relief of the sample’s surface over a straight line. Clearly the circular nature of this exercise renders it useless for any research data on the image. Rather, this exercise is useful in enabling the student to learn the underlying physics of the STM.
III. MODELLING AND ALGORITHM
Simplified models determine the effect of various parameters in an STM. Some of these models may not be entirely valid in a real STM, however, they yield correct semi-qualitative results to help students learn the physics. The models and algorithms used are described below.
Sample Cross Section
The user draws a straight line across the sample’s surface with a cursor representing the motion of the probe tip. The program records the color of each pixel on the straight line, and creates a cross sectional profile. The height of the profile at any point is proportional to the intensity value of the pixel at that point on the line.
Electric Potential and Field
The electric potential in the region above the sample’s surface in this program is determined by numerically solving Poisson’s equation in the space above the sample’s surface4 in a discretized grid representing 2D space. This problem is not significant in a real STM because the probe tip radius of curvature of the probe tip is much larger than the features on sample’s surface. The electric field line is the direction of steepest descent of the electric potential, and in most cases are vertically down from the probe tip.
Potential Energy
The potential energy is proportional to the value of electric potential along the field line. This difference in electron affinities between the sample and air is the height of the potential energy barrier experienced by the electron. Hence, the potential energy is:
 in the sample
 in the air gap, and (1)
 in the probe tip
where f B is the barrier height in eV.
q is the electronic charge.
V(x) is the electric potential in volts at a point x, and
Vtip is the probe tip voltage,
Wave Function
The wave function is determined by numerically solving the discretized time independent Schrodinger’s equation4 for the tunneling electron, along the field line:
 (2)
where ‘d’ is the distance between two point n and n+1 along the field line. For convergence, the field line is divided into steps of size ‘d’, which meet the following criteria:
 (3)
For an electron tunneling from the sample to the probe tip, the wave function to the right of the barrier is a purely transmitted wave, so the initial conditions are:
 and
and  (4)
Tunneling Probability
Given the potential energy of the tunneling electron at every point along the field line the tunneling probability can be calculated using the WKB approximation4:
 (5)
where k(x) is :
 (6)
where U(x) is the potential energy of the electron. The numerical integration is performed using the trapezoidal rule.
Tunneling Current
The tunneling current is calculated from a weighed sum due to tunneling electrons over a range of energies.
 (7)
where:
n (E) = f(E) D(E) is the concentration of electrons on the n side in the energy range E and E + dE, and
 is the thermal velocity of the tunneling electrons of energy E.
The program calculates the tunneling current for a specified probe tip voltage and position and then repeats equation (7) for each voltage to generate the I-V curve. The current profile is determined from equation (7) at each point that the probe tip is dragged through.
Although the aforementioned numerical procedure appears long and involved, our program, when run on a 486PC (50MHz) takes about two seconds to compute the current profile.
IV. PEDAGOGICAL APPLICATIONS
The STM Simulator program is, to our knowledge, the only computer program that enables students to learn about the physical principles of an STM. We have found the program useful in enabling students to relate seemingly abstract concepts such as potential energy diagrams and wave functions to a more concrete application. The relationship between quantum mechanical ideas and the real world is emphasized by using a real STM image.
The program does not require any knowledge of higher level mathematics. Introductory undergraduate or high-school students can utilize the program to obtain a semi-quantitative feel for how the STM creates an image of the sample and how various parameters such as probe tip voltage and distance of probe tip from the sample’s surface affect the performance of an STM. In this environment, where the students are not interested in the quantum mechanics of the STM, but rather in its basic operation, the program can be used only with the STM Image, Cross Section and Current Profile windows open. For physics or engineering students at the senior undergraduate level, the program can be used to learn how quantum mechanics is related to the STM using the Potential Energy, Wave Function and Tunneling Probability windows.
All of the aforementioned features of the program make it an attractive piece of educational software. The program is not meant to be used as a substitute for a real STM. Due to the circular reasoning involved, it is definitely not intended to be a research tool for analysis of real samples. It is merely a pedagogical tool for teaching the underlying physics of an STM.
V. SUMMARY
The STM Simulator describes the working principle of an STM by allowing the student to "analyze" any real image in much the same way as a real STM would, by moving the probe tip across the surface of the sample. The program is hence circular, since it assumes that the STM image is a true representation of the surface and proceeds to reconstruct it. The program displays a cross section of the sample along the line of scan, and then numerically solves the 2D Poisson’s equation in the vicinity of the sample’s surface to determine the electric potential and field. Next, the program displays the potential energy diagram and calculates the wave function for the tunneling electron, by numerically solving Schrodinger’s equation along the field line. The program also calculates the variation of the tunneling probability with electron energy and probe tip voltage.
The student relates these abstract quantum mechanical quantities to the more tangible tunneling current. The I-V graph is displayed by the program for any given position of the probe tip, and finally, the student determines the current profile as the probe tip is dragged above the sample’s surface, in either the "constant height" or the "constant current" mode.
The program can be used by students over a range of academic levels since it does not require any knowledge of higher level math. We emphasize that the program cannot be used for analyzing real STM data for research purposes, because of its circular argument. The values of several parameters are unrealistic, although the qualitative variation of these parameters is correct. Both the Windows and Macintosh versions of the program can be downloaded from our World Wide Web site http://www.phys.ksu.edu/perg/vqm .
LIST OF REFERENCES
1 Supported by the National Science Foundation, under grant ESI945782.
2 Neddermeyer, Scanning Tunneling Microscopy, Kluwer Academic Publishers, 1993, the Netherlands.
3 Joseph A. Stroscio and William J. Kasier, Scanning Tunneling Microscopy, Academic Press Inc., 1993.
4 Steven E. Koonin, Computational Physics, The Benjamin/Cummins Publishing Company Inc., 1986.
5 David Bohm, Quantum Theory, Dover Publications Inc., New York, 1989.


 (4)
Tunneling Probability
Given the potential energy of the tunneling electron at every point along the field line the tunneling probability can be calculated using the WKB approximation4:
 (5)
where k(x) is :