Now, create the wave function for each region.
Click the "Region I" tab, and adjust the "wavelength" of the wave function in Region I (empty space) to the value calculated above. Click the "Check" button to verify if your wavelength is correct.
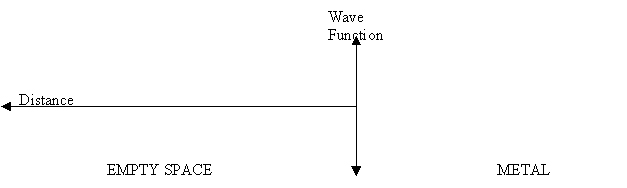
Make a sketch of the wave function of the electron in empty space, as displayed by the Wave Function Sketcher and indicate the de Broglie wavelength on your sketch.
You may like to print the graph below to make your sketch:
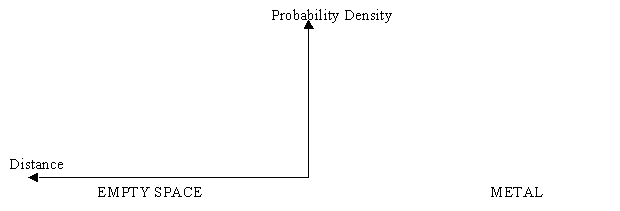
Using the wave function graph you have sketched, draw a probability density graph of the electron in empty space. You may like to print the graph below to make your sketch.
Now we will repeat the process for the second region.
Click the "Region II" tab, and adjust the "wavelength" of the wave function in Region II (i.e. in the metal) to the value calculated above. Click the "Check" button to verify if your wavelength is correct.
Sketch the wave function of the electron in the metal and probability density on the right sides of the previous graphs you have sketched.
You have now completed step 2 in drawing wave functions, you have determined the wavelength in each region (if possible) and made a sketch of the wavefunction.
Later we will modify step 2 to explain the "if possible"
aside.
![]()
![]()